The players, according to SNY.tv’s Andy Martino, are expected to approve the safety protocols required to go ahead and start planning for a season that would start around July 24. They are expected to inform MLB today that and the fact that they can report to camp starting on July 1st.
The season, in the case that players approve the aforementioned things, as is expected, will last 60 games, instead of the regular 162-game calendar that has been the norm for decades. Such a dramatic reduction would mean that most stats would have less time to stabilize, which in turn means that more randomness enters the equation.
Steve Slowinski wrote a piece for Fangraphs about sample size to explain the matter. It is rather old (2010) but the points remain:
“When dealing with pitches flying 90+ miles per hour and split second movements, a whole bunch of randomness gets thrown into the pot. This means that any one plate appearance might have a funky result, meaning that you need to see lots of events to get a clear picture of what is going on. You know this. One time Don Kelly took Yu Darvish deep,” he said.
One, or ten plate appearances aren’t convincing amounts of data. It could help, but it’s not enough information to inform our opinion. We need more data points until we have enough for them to “stabilize.â€
For reference, these are some stabilizing points on MLB statistics. Again, this is not exact, it is an attempt by the sabermetric circle to establish when does a stat begins to feel more “real” and less “fluky”:
“Stabilization†Points for Offense Statistics:
- 60 PA: Strikeout rate
- 120 PA: Walk rate
- 240 PA: HBP rate
- 290 PA: Single rate
- 1610 PA: XBH rate
- 170 PA: HR rate
- 910 AB: AVG
- 460 PA: OBP
- 320 AB: SLG
- 160 AB: ISO
- 80 BIP: GB rate
- 80 BIP: FB rate
- 600 BIP: LD rate
- 50 FBs: HR per FB
- 820 BIP: BABIP
“Stabilization†Points for Pitching Statistics:
- 70 BF: Strikeout rate
- 170 BF: Walk rate
- 640 BF: HBP rate
- 670 BF: Single rate
- 1450 BF: XBH rate
- 1320 BF: HR rate
- 630 BF: AVG
- 540 BF: OBP
- 550 AB: SLG
- 630 AB: ISO
- 70 BIP: GB rate
- 70 BIP: FB rate
- 650 BIP: LD rate
- 400 FB: HR per FB
- 2000 BIP: BABIP
For reference, PA is plate appearances, BF is batters faced, and BIP is balls in play.
Batting average needs, according to that list, 910 at-bats to stabilize, and in a 60-game season, MLB hitters will have substantially fewer than that number. Consider that Marcus Semien led the league with 747 at-bats in 2019, and he played the full 162 games.
And average feels even more fluky or random than power stats, for example. This could lead to surprising end-of-the-season leaders in several categories.
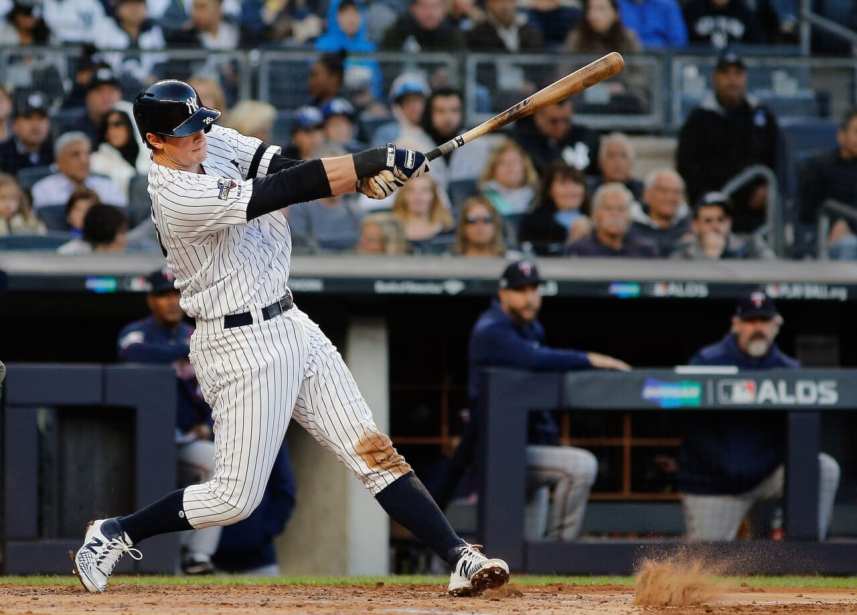
With this setting, is easy to imagine Yankees‘ star DJ LeMahieu winning a batting title, or Mets‘ hitting machine Jeff McNeil doing it as well.
Michael Conforto has what it takes to lead the league in home runs in such a short season, and who knows who the MVP candidate will be if usual suspects, such as Mike Trout or Alex Bregman, start off slow.
There might not be enough time to recover from a sluggish start, stats-wise. And streaky hitters could lead their circuit in several categories. Only time will tell, but one thing is certain: it will be a rare, funny little season that may be full of surprises.